2022 / Day 28: 3D
I cant remember exactly which years in school this was (8th or 9th grade, meaning abt 13-14-15 y.o. I was?) but we used to have technical drawing classes. Mainly I did pretty good at it (if it wasn’t for those pesky pencils smothering all over the place), but I guess I had an edge too - both of my parents were doing technical drawings of houses (essentially go out, take measurements, and then later draw the whole thing up in 1:100 scale) so I had had a chance to practice hand before. And this was before the advent of PCs so this was all done by hand - first a draft with pencil on paper and then afterwards a clean one on tracing paper with ink.
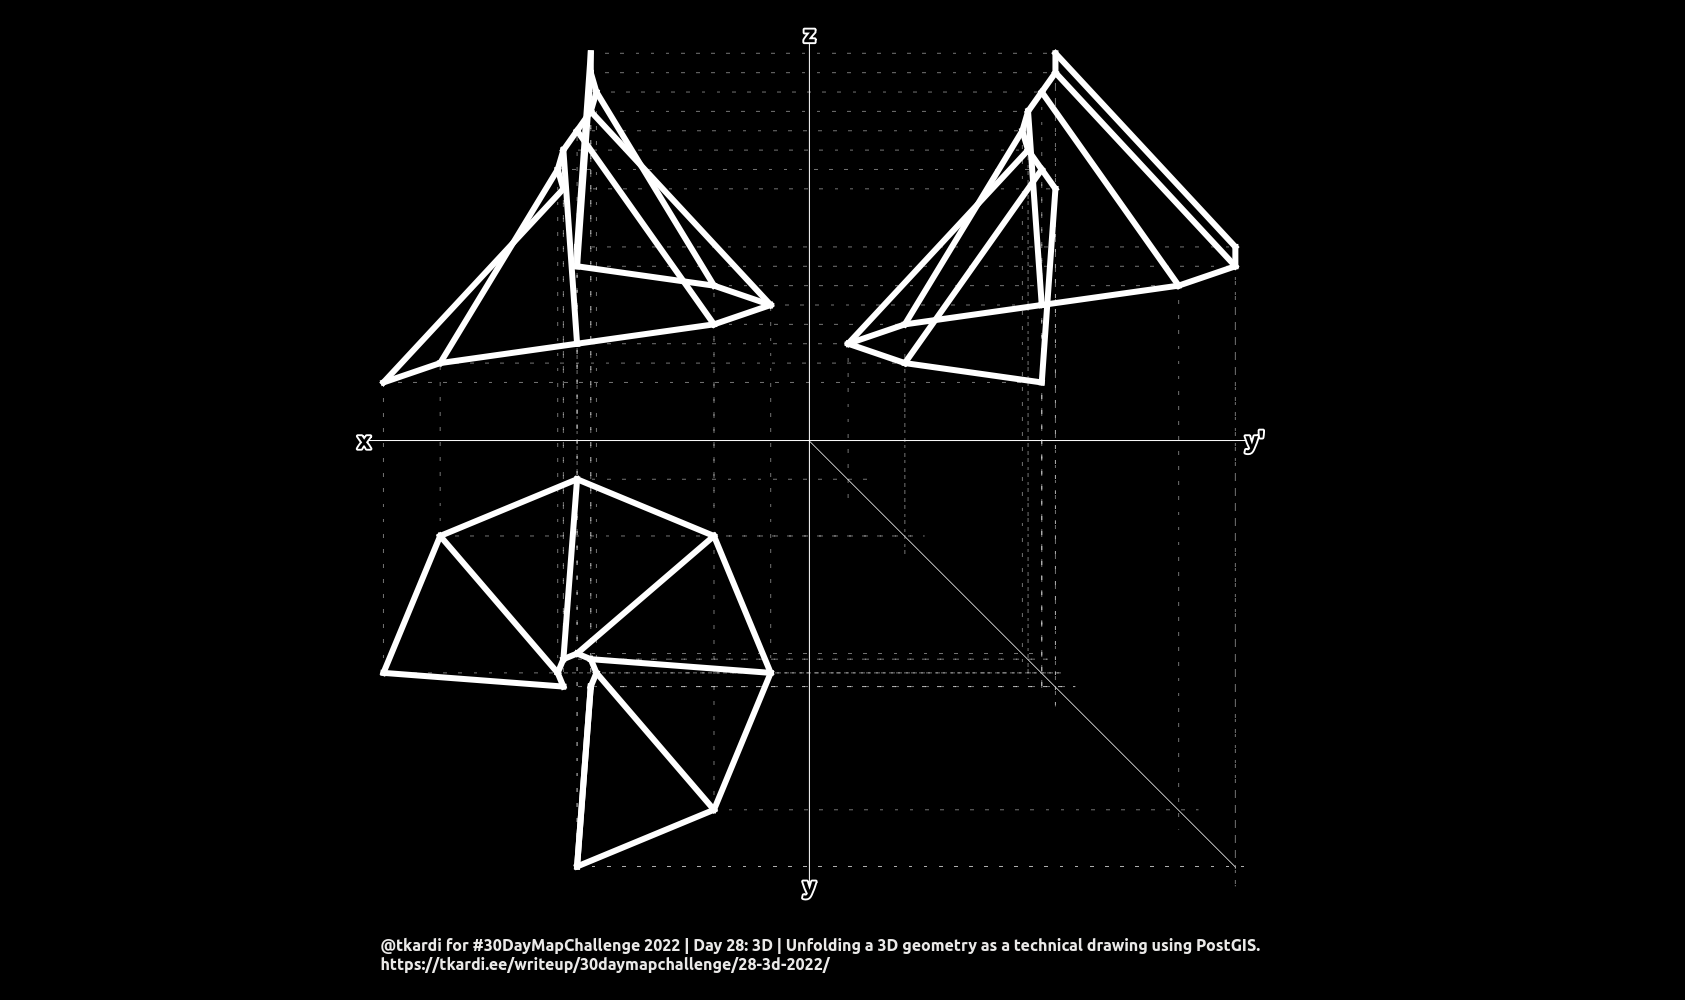
I really don’t recall the process or the supposed buildup (view placement
on paper) of the bolts and nuts or whatnot we drew in school, but I remember
the sheet was divided into four parts with a view from top (x-y coordinate
space), view from side "A" (in x-z coordinate space), and view from side "B"
(in y-z coordinate space).
Today’s challenge, as a process is essentially very similar to what I was doing about two years ago when lofting the new boat - with the only difference: the boat was done on paper (on three sheets of stitched together paper, to be exact). And all the curves needed to be lofted with the help a straight long batten, a hammer, some nails to the floor, and pen. While in this case PostGIS takes the heat off from transferring all points with exact measurements to the other views. If you’re interested in my lofting experiences then you can read about it a bit longer here.
But for the SQL: it will first create a 3D cone-like-half-cylinder from a
st_boundary boundary of a
st_buffered point
(see CTEs pts and rings). st_scale
the top part a wee smaller and “spiral” (not really, only curl up) all the
points for top / base parts of the geometry.
The rest is plotting points from the known values (in
xy_plot_pts, xz_plot_pts, yz_plot_pts) to other axis values so for example
the nodes of the geometry in the xz plot are set up as
st_point(
    -1.0 * (st_x(node.geom)),
    st_z(node.geom)
)
and the yz plot nodes as
st_point(
    st_y(node.geom),
    st_z(node.geom)
)
Note the use of -1.0 in xy and xz plots - this rotates the coordinates
for the axis around.
And then finally helper_lines constructs a set of helper lines that would be
useful for transferring measurement (!) values from one view to the other.
These lines are always perpendicular to the axis of the drawing.
with
    pts as (
        select (
            st_dumppoints(
                st_linesubstring(
                    st_boundary(
                        st_buffer(
                            st_point(0, 0),
                            1000,
                            'quad_segs=2'
                        )
                    ),
                    0.0,
                    0.75
                )
            )
        ).*
    ),
    rings as (
        select
            1 as ring, path[1] as ord,
            st_translate(
                st_force3d(geom),
                0,0,
                path[1] * 100.0
            ) as geom
        from
            pts g
        union all
        /* make the upper part smaller so the whole thin would be cone-like
           with a winding top*/
        select
            2 as ring, path[1] as ord,
            st_rotate(
                st_scale(
                    st_translate(
                        st_force3d(geom),
                        0,0,
                        1000.0 + path[1] * 100.0
                    ),
                    0.1,
                    0.1,
                    1
                ),
                radians(45),
                st_point(0,0)
            ) as geom
        from pts g
    ),
    bounds as (
        /* use bounds to shift the different view diagrams into
           different places*/
        select
            st_xmin(geom), st_xmax(geom), st_ymin(geom),
            st_ymax(geom), st_zmin(geom), st_zmax(geom)
        from (
            select
                st_collect(geom) as geom
            from rings
        ) o
    ),
    xy_plot_pts as (
        /* extract point for xy-view: from the top
           st_translate to lower-left part of the drawing.
           since both of the axis are "decreasing" turn
           the coordinates around*/
        select
            ring, ord,
            st_translate(
                geom,
                -1.0 * (st_xmax-st_xmin) * 0.6 ,
                -1.0 * (st_xmax-st_xmin) * 0.6
            ) as geom
        from (
            select
                ring, ord,
                st_point(
                    -1.0 * st_x(geom),
                    -1.0 * st_y(geom)
                ) as geom
            from
                rings
        ) r, bounds
    ),
    xz_plot_pts as (
        /* extract points for xz-view: from the side
           st_translate to upper left part of the drawing.
           z axis is increasing, but x is still decrasing and
           needs to be reversed*/
        select
            ring, ord,
            st_translate(
                geom,
                -1.0*(st_xmax-st_xmin) * 0.6 ,
                (st_xmax-st_xmin) * 0.1
            ) as geom
        from (
            select
                ring, ord,
                st_point(
                    -1.0 * st_x(geom),
                    st_z(geom)
                ) as geom
            from
                rings
        ) r, bounds
    ),
    yz_plot_pts as (
        /* extract points for yz-view: from the side
           st_translate to upper right part of the drawing.
           both axis are increasing so everything ok*/
        select
            ring, ord,
            st_translate(
                geom,
                (st_xmax-st_xmin) * 0.6,
                (st_xmax-st_xmin) * 0.1
            ) as geom
        from (
            select
                ring, ord,
                st_point(
                    st_y(geom),
                    st_z(geom)
                ) as geom
            from
                rings
        ) r, bounds
    ),
    xy_plot as (
        /* plot the geometry's lines in xy-view*/
        select
            st_makeline(a.geom, b.geom) as geom
        from
            xy_plot_pts a,
            xy_plot_pts b
        where (
            (a.ring = b.ring and a.ord + 1 = b.ord ) or
            (a.ring + 1 = b.ring and a.ord = b.ord )
        )
    ),
    xz_plot as (
        /* plot the geometry's lines in xz-view*/
        select
            st_makeline(a.geom, b.geom) as geom
        from
            xz_plot_pts a,
            xz_plot_pts b
        where (
            (a.ring = b.ring and a.ord + 1 = b.ord ) or
            (a.ring + 1 = b.ring and a.ord = b.ord )
        )
    ),
    yz_plot as (
        /* plot the geometry's lines in yz-view*/
        select
            st_makeline(a.geom, b.geom) as geom
        from
            yz_plot_pts a,
            yz_plot_pts b
        where (
            (a.ring = b.ring and a.ord + 1 = b.ord ) or
            (a.ring + 1 = b.ring and a.ord = b.ord )
        )
    ),
    helper_lines as (
        /* helper lines are here for us to show how the locations
           of vertices would be drawn up on paper for other axis where we
           don't know exact values*/
        select
            st_makeline(a.geom, b.geom) as geom
        from
            xy_plot_pts a,
            xz_plot_pts b
        where
            a.ring = b.ring and a.ord=b.ord
        union all
        select
            st_makeline(a.geom, b.geom) as geom
        from
            xz_plot_pts a,
            yz_plot_pts b
        where
            a.ring = b.ring and a.ord=b.ord
        union all
        select
            /* in the lower right corner from
               xy-view until the bisection line*/
            st_makeline(
                a.geom,
                st_point(
                    -1.0 * st_y(a.geom) + 100.0,
                    st_y(a.geom)
                )
            ) as geom
        from
            xy_plot_pts a
        union all
        select
            /* in the lower right corner from
               the bisection line to the yz-view*/
            st_makeline(
                st_point(
                    st_x(a.geom),
                    -1.0 * st_x(a.geom) - 100.0
                ),
                a.geom
            ) as geom
        from
            yz_plot_pts a
    )
/* And pull everything together*/
select
    row_number() over()::int as oid, geom , cl, lbl
from (
    select
        geom, 'xy' as cl, null as lbl from xy_plot
    union all
    select
        geom, 'xz' as cl, null as lbl from xz_plot
    union all
    select
        geom, 'yz' as cl, null as lbl from yz_plot
    union all
    select
        geom, 'helper_line' as cl, null as lbl
    from helper_lines
    union all
    /* ..and construct all axis lines*/
    select
         (array[
            st_makeline(st_point(0,0), st_point(xmin.xmin - 100.0, 0)),
            st_makeline(st_point(0,0), st_point(xmax.xmax + 100.0, 0)),
            st_makeline(st_point(0,0), st_point(0, ymin.ymin - 100.0)),
            st_makeline(st_point(0,0), st_point(0, ymax.ymax + 100.0)),
            st_makeline(st_point(0,0), st_point(xmax.xmax, ymin.ymin))
        ])[i] geom,
        'axis' as cl,
        (array['x', 'y''', 'y', 'z', ''])[i] as lbl
    from
        generate_series(1,5,1) i,
        (select min(st_xmin(geom)) as xmin from xy_plot) xmin,
        (select max(st_xmax(geom)) as xmax from yz_plot) xmax,
        (select min(st_ymin(geom)) as ymin from xy_plot) ymin,
        (select max(st_ymax(geom)) as ymax from yz_plot) ymax
    ) x
;